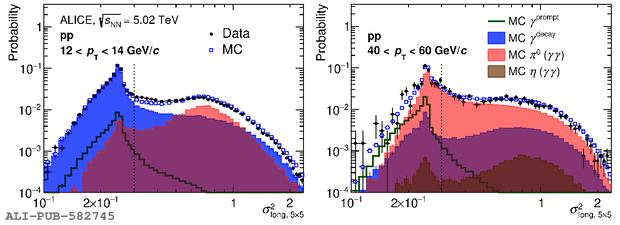
Inclusive-cluster \sigmalongPb\ distribution in data (black bullets) and PYTHIA~8 simulation (jet--jet+$\gamma$--jet processes, blue squares). The four panels display these distributions for two selected cluster \pt\ ranges, $12\pt14$~\GeVc on the left and $40\pt60$~\GeVc on the right, and two collision systems: \pp (top) and \PbPb 0--10\% central (bottom). The simulation is decomposed in its different particle origins: prompt $\gamma$ ($\gamma^{\rm prompt}$, green line), not merged decay $\gamma$ ($\gamma^{\rm decay}$, blue area), merged decay photon clusters ($\gamma\gamma$) from \piz (red area) or $\eta$ (brown area) The threshold value $\sigmalongPb~=~0.3$ or 0.392 (corresponding to $\sigma_{\rm max}^{2}$(13~\GeVc)) is shown on all plots as a dotted or dashed vertical line, respectively.
Figure extracted from paper
