Scope: PWG
PWG-CF (Flow and Correlations)
Energy
5.02 TeV
System
Pb-Pb
Figure Group
Figure Image

Figure image (.eps)
Figure image (.pdf)
Figure Caption
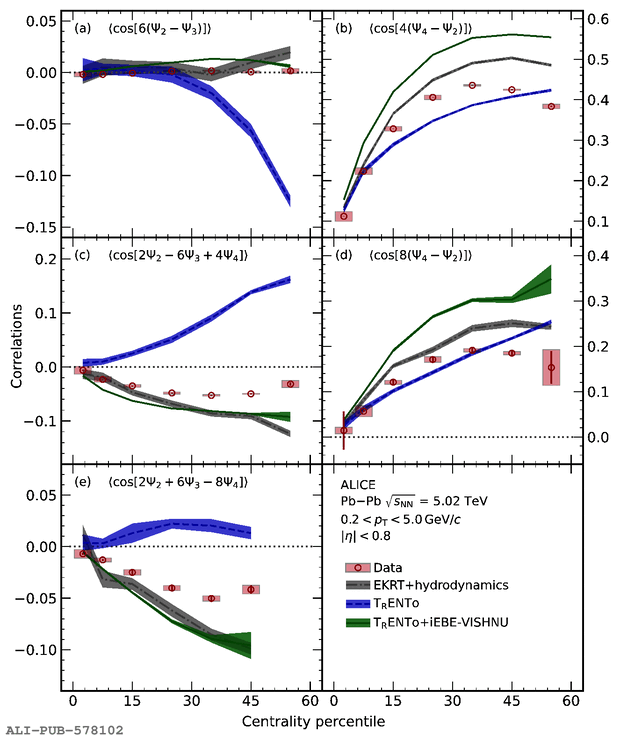
Comparison of the centrality dependence of the correlations involving $\Psi_2$, $\Psi_3$, and $\Psi_4$ (red circles) with the theoretical predictions from \trento+iEBE-VISHNU~ and EKRT+hydrodynamics~ shown as green and gray bands, respectively. Initial-state predictions from \trento~calculated with cumulant expansions are shown as blue bands. The lines (boxes) represent the statistical (systematic) uncertainties of the experimental data. The widths of the bands denote the statistical uncertainty of the model predictions.
Detail description
Figure extracted from paper
