Scope: PWG
PWG-LF (Light Flavour Spectra)
Energy
2.76 TeV
5.02 TeV
7 TeV
8 TeV
13 TeV
System
p-p
Pb-Pb
p-Pb
Figure Group
Figure Image

Figure image (.eps)
Figure image (.pdf)
Figure Caption
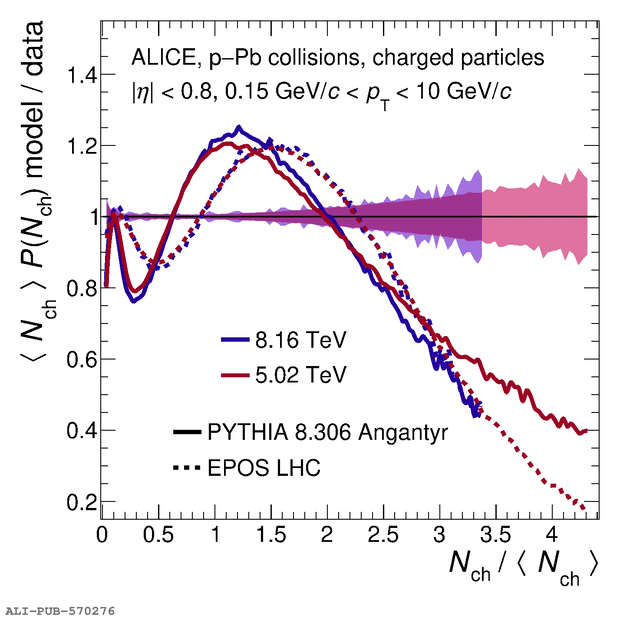
Ratio of model predictions to data for \ppb collisions at various energies. The upper panels show it for the multiplicity distributions (left) and their KNO-scaling form (right), the bottom panels represent \mpt (left) and \sigmapt (right). The semi-transparent bands indicate the relative systematic uncertainties of the data.
Detail description
Figure extracted from paper
