Scope: PWG
PWG-MM (Monte Carlo generators and Minimum Bias)
Energy
5.02 TeV
System
Pb-Pb
Figure Group
Figure Image

Figure image (.eps)
Figure image (.pdf)
Figure Caption
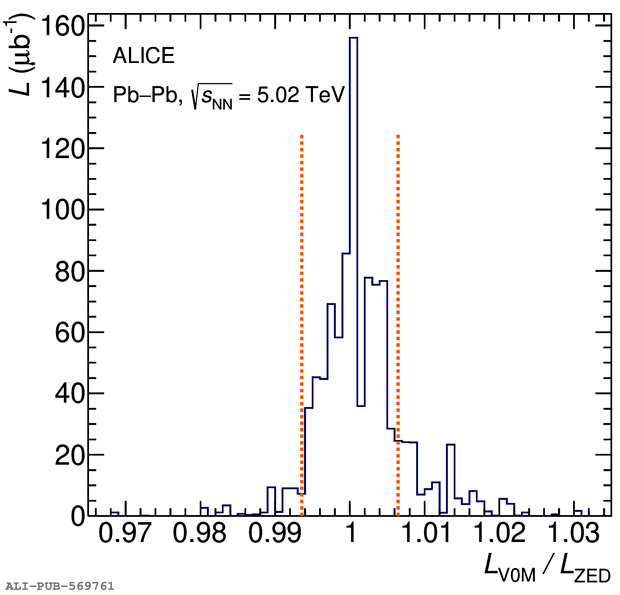
Left: ratio of V0M and ZED luminosities calculated according to Eq.~\ref{eq:V0MtoZED} as a function of time with respect to the beginning of the data-taking periods for 2015 (circles) and 2018 (squares). The uncertainties are statistical. Right: distribution of the ratios for all runs (2015 and 2018), weighted with the run luminosity. The dashed vertical lines are located at $L_{\rm{V0M}}/L_{\rm{ZED}}=1$~$\pm$~$\alpha$, where $\alpha$~$\sim$~0.007 is the mean quadratic difference from unity.
Detail description
Figure extracted from paper
