Scope: PWG
PWG-JE (Jets)
Energy
5.02 TeV
System
Pb-Pb
Figure Group
Figure Image
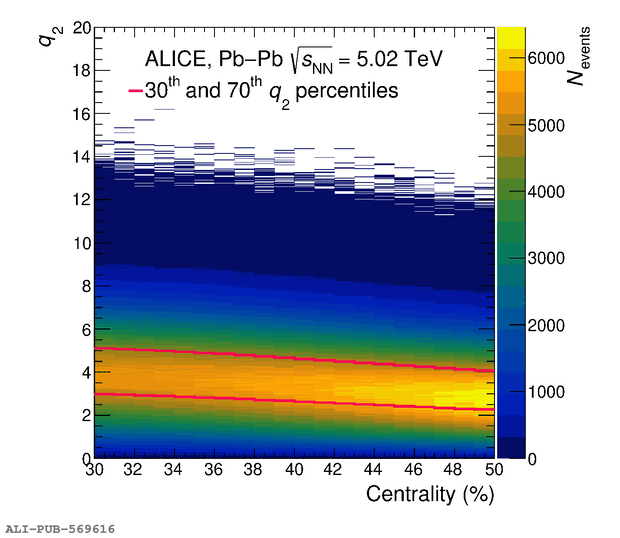
Figure image (.eps)
Figure image (.pdf)
Figure Caption
Distribution of $q_{\rm 2}$ values as a function of centrality in \PbPb collisions at \fivenn. Pink lines demarcate the 30\textsuperscript{th} and 70\textsuperscript{th} $q_{\rm 2}$ percentiles, as calculated within $1\%$-wide centrality intervals.
Detail description
Figure extracted from paper