Scope: PWG
PWG-LF (Light Flavour Spectra)
Energy
5.02 TeV
System
Pb-Pb
Figure Group
Figure Image
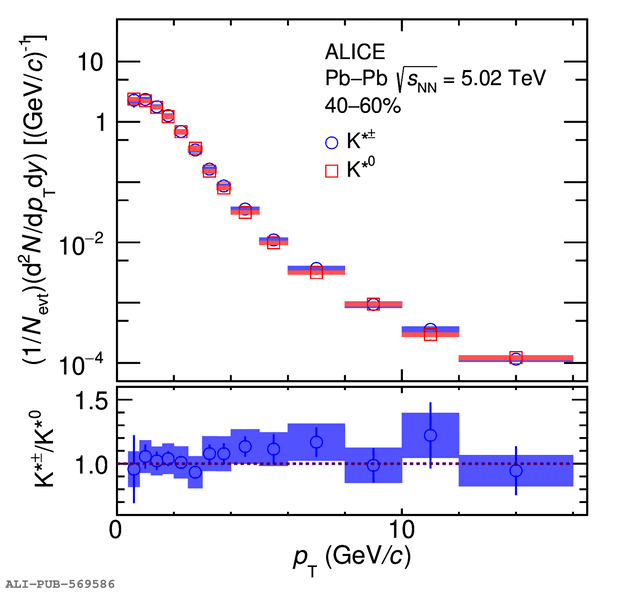
Figure image (.eps)
Figure image (.pdf)
Figure Caption
The \pt distributions of \CKSshort (blue circles) and \NKSshort (red squares)~ in 0$-$10$\%$ (left) and 40$-$60$\%$ (right) centrality intervals in Pb--Pb collisions at \snn $=$ 5.02 TeV. Statistical and systematic uncertainties are shown by bars and shaded boxes, respectively. The bottom panels show the \CKSshort\xspace to \NKSshort\xspace ratio as a function of \pt.
Detail description
Figure extracted from paper