Scope: PWG
PWG-CF (Flow and Correlations)
Energy
5.02 TeV
5.44 TeV
System
p-p
Pb-Pb
Xe-Xe
Figure Image
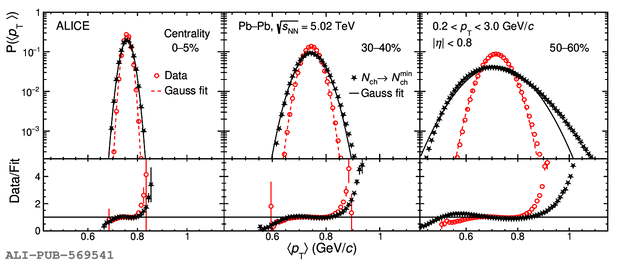
Figure image (.eps)
Figure image (.pdf)
Figure Caption
Comparison of event-by-event mean transverse momentum $\langle p_\mathrm{T}\rangle$ distribution from actual analysis and modified analysis in which $N_\mathrm{ch}$ in each event is fixed to $N_\mathrm{ch}^\mathrm{min}$ ($N_\mathrm{ch}^\mathrm{min}$ is the minimum number of charged particles in a given centrality class) and $N_\mathrm{ch}^\mathrm{min}$ number of particles are selected in each event randomly for the 0--5\% (left), 30--40\% (middle), and 50--60\% (right) centrality classes.
Detail description
Figure extracted from paper