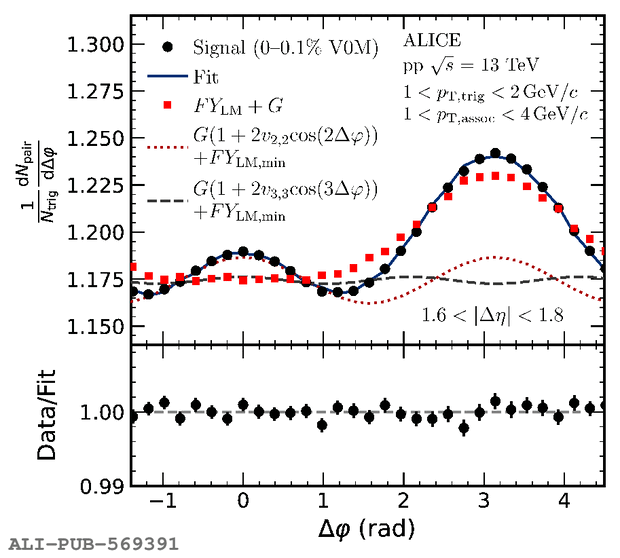
Per-trigger yield in $1.6|\Delta\eta|1.8$ extracted from 0--0.1\% and 60--100\% multiplicity percentile events in $\sqrt{s}=13$~TeV pp collisions. The data are fitted with the template fit method described by Eq.~???. The black markers show the signal for the 0--0.1\% multiplicity percentile. The red squares correspond to the low-multiplicity signal. The red and gray curves correspond to the extracted $v_{2,2}$ and $v_{3,3}$ signals, respectively. To improve visibility, the baselines of flow signals are shifted by $FY_{\mathrm{LM,min}}$, which represents the minimum yield of $FY_{\mathrm{LM}}(\Delta\varphi)$. The signal-to-fit ratio is shown in the bottom panel. The $\chi^{2}$ divided by the number of degrees of freedom is 0.894.
Figure extracted from paper
