Scope: PWG
PWG-MM (Monte Carlo generators and Minimum Bias)
Energy
5.02 TeV
13 TeV
System
p-p
Figure Image

Figure image (.eps)
Figure image (.pdf)
Figure Caption
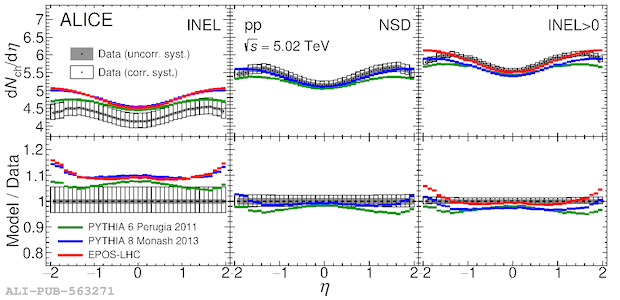
The distributions of $\dndeta$ for INEL (left panel), NSD (middle panel), and $\inelg$ (right panel) event classes in pp collisions at $\sqrt{s} = 5.02$ TeV. Data are compared to simulations obtained with PYTHIA 6 with the Perugia 2011 tuning, PYTHIA 8 with the Monash 2013 tuning, and EPOS-LHC. Grey bands (unfilled rectangles) represent the uncorrelated (correlated) systematic uncertainties from data. The bottom part of the figure shows the ratios between models and data.
Detail description
Figure extracted from paper
