Scope: PWG
PWG-CF (Flow and Correlations)
Energy
13 TeV
System
p-p
Figure Group
Figure Image

Figure image (.eps)
Figure image (.pdf)
Figure Caption
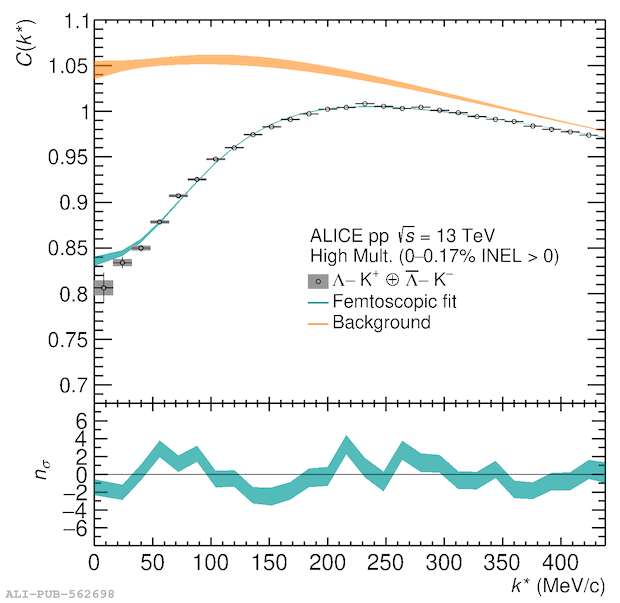
Measured correlation function of \LKPlus pairs. Statistical (bars) and systematic (boxes) uncertainties are shown separately. The light cyan band represents the total fit obtained using Eq.~??? from which the normalization $N_D$, and the scattering parameters (\Rescatt,\Imscatt, and \effran) are extracted. The orange band represents the $C_\mathrm{background}(\kstar)$ contribution, modeled as described in Section~???, and multiplied by the constant $N_D$. Lower panel: $n_\sigma$ deviation between data and model in terms of numbers of standard deviations.
Detail description
Figure extracted from paper
