Scope: PWG
PWG-LF (Light Flavour Spectra)
Energy
5.02 TeV
System
Pb-Pb
Figure Image

Figure image (.eps)
Figure image (.pdf)
Figure Caption
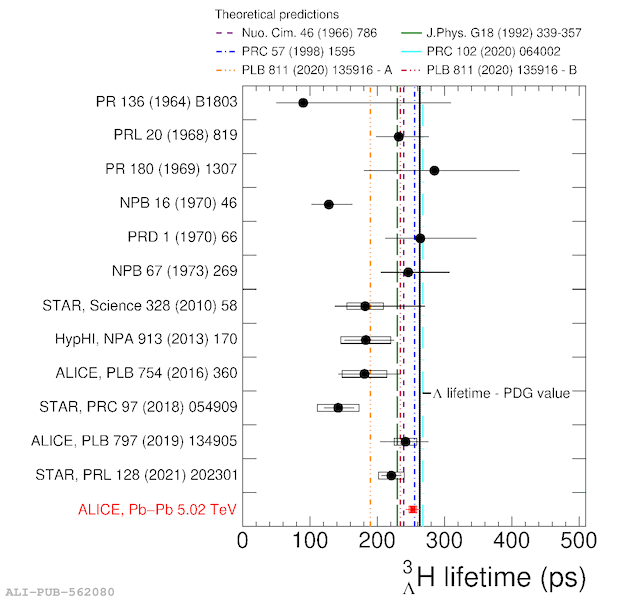
Collection of the \hyp lifetime (left)~ and \BL (right)~ measurements obtained with different experimental techniques. The horizontal lines and boxes are the statistical and systematic uncertainties, respectively. The dashed and dash-dotted lines are the corresponding theoretical predictions~ Two predictions are reported in~: prediction A assumes \BL = 130 keV, while prediction B assumes \BL = 69 keV.
Detail description
Figure extracted from paper
