Scope: PWG
PWG-LF (Light Flavour Spectra)
Energy
5.02 TeV
System
p-p
Figure Image

Figure image (.eps)
Figure image (.pdf)
Figure Caption
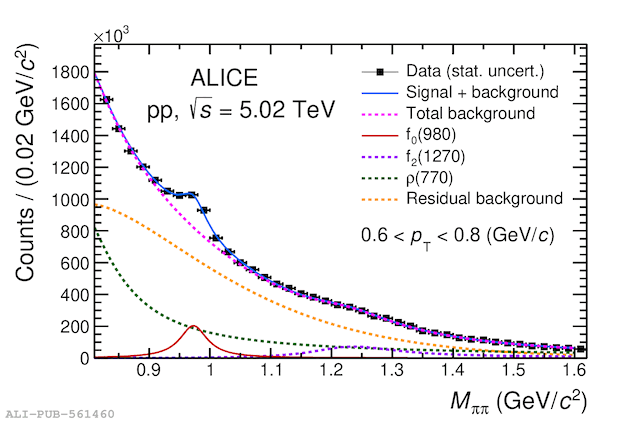
Left (right) plot shows the invariant mass distribution of \ensuremath{\pi^{+}}\ensuremath{\pi^{-}} pairs after like-sign background subtraction in low (high) transverse-momentum interval in \pp collisions at \five in $\vert y\vert 0.5$. Solid blue curves represent fits with the function shown in Eq.~\ref{eq1} and a residual background shown in Eq.~\ref{eq3}. Solid red curve represents \fzero signal while other dashed curves represent the background contributions from \rhozero, \ftwo and residual background.
Detail description
Figure extracted from paper
