Scope: PWG
PWG-JE (Jets)
Energy
5.02 TeV
System
p-p
Figure Image

Figure image (.eps)
Figure image (.pdf)
Figure Caption
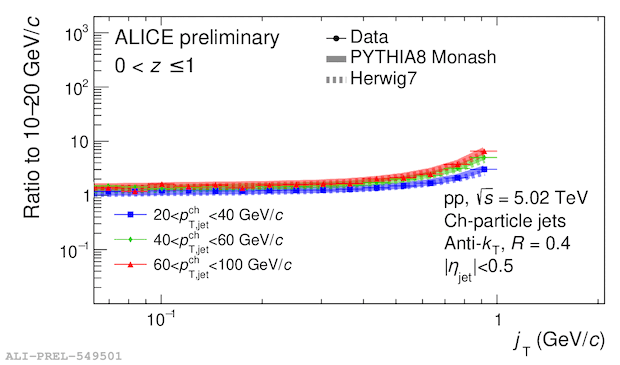
Figure shows ratios to the $j_\mathrm{T}$ distributions in 10 < $p_\mathrm{T,jet}^\mathrm{ch}$ < 20 GeV/$c$ of other $p_\mathrm{T,jet}^\mathrm{ch}$ ranges in inclusive $z$ bin ( $0 < z \leq 1$ ).
Detail description
This figure is the derived plot from the last preliminaries.
The plot shows jet $p_\mathrm{T}$ dependence of the $j_\mathrm{T}$ in inclusive $z$.
Filled markers indicate truth data $j_\mathrm{T}$ and solid line mean mc $j_\mathrm{T}$ generated with PYTHIA8 and dashed line is from Herwig7.
$p_\mathrm{T,jet}^\mathrm{ch}$ ranges of 10~20, 20~40, 40~60, 60~100 GeV/$c$ are shown.
