Scope: PWG
PWG-CF (Flow and Correlations)
Energy
13 TeV
System
p-p
Figure Image
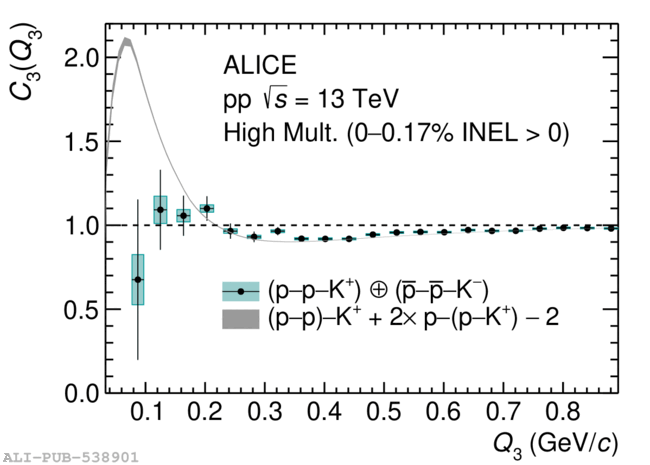
Figure image (.eps)
Figure image (.pdf)
Figure Caption
Correlation functions (data points) for \ppKp (left panel) and \ppKm (right panel) compared to the lower-order contributions evaluated using the projector method (grey bands). Statistical and systematic uncertainties are represented by error bars and green boxes, respectively. The band widths represent the combined statistical and systematic uncertainties propagated from the two-particle correlation functions used as input to the projector method.
Detail description
Figure extracted from paper