Scope: PWG
PWG-HF (Heavy Flavour)
Energy
13 TeV
System
p-p
Figure Image

Figure image (.eps)
Figure Caption
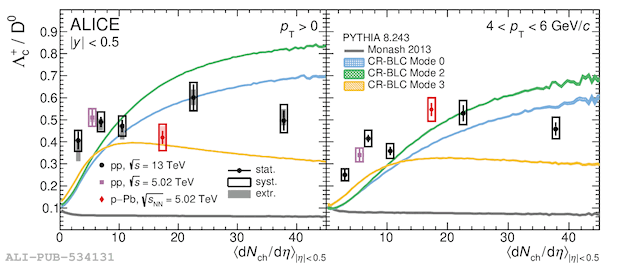
The pT-integrated Λc /D0 yield ratios extrapolated for pT > 0 (left panel) and
for the 4 < pT < 6 GeV/c interval (right panel). Statistical and systematic uncertainties are shown by error bars and
empty boxes, respectively, while the shaded boxes represent the extrapolation uncertainties. The corresponding
PYTHIA predictions are also shown.
