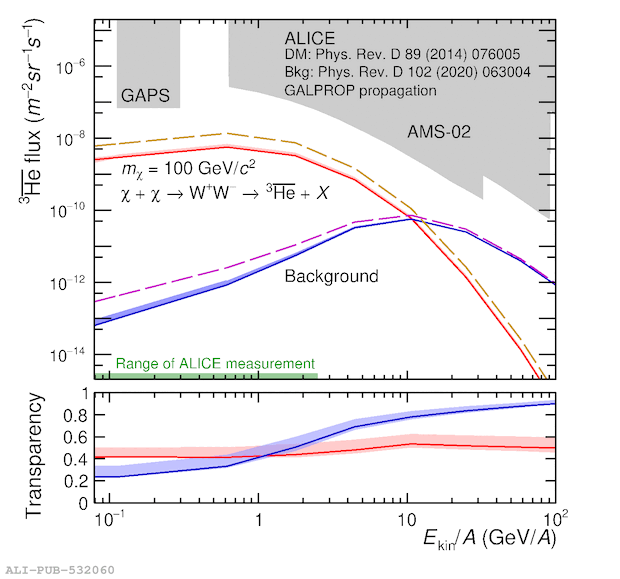
Expected \ahe\ flux near Earth before and after solar modulation. Data before (left) and after (right) solar modulation. The latter is obtained using the force-field method with modulation potential $\mathrm{\phi} =$ 400 MV. The results are shown as a function of kinetic energy per nucleon $E_{\rm kin} / A$. Fluxes for DM signal $\chi$ (red) and cosmic-ray background (blue) antihelium nuclei for different cases of inelastic cross section used in the calculations (top). The bands show the results obtained with \sigmainel\ from ALICE measurements, and the full lines correspond to the results using the \geant\ parameterizations. The dashed lines show the fluxes obtained with \sigmainel\ set to zero for DM signal (orange line) and for cosmic-ray background (magenta line). The green band on the x axis indicates the kinetic energy range corresponding to the ALICE measurement for \sigmainel. Transparency of our Galaxy to the propagation of \ahe\ outside (left) and inside (right) the Solar System (bottom). The shaded areas (top right) show the expected sensitivity of the GAPS~ and AMS-02~ experiments. The top panels also shows the fluxes obtained with \sigmainel\ set to zero. Only the uncertainties relative to the measured \sigmainel\ are shown, which represent standard deviations. The calculations employ the \ahe\ DM source described elsewhere~ and the \ahe\ production cross section from cosmic-ray background~.
Figure extracted from paper
