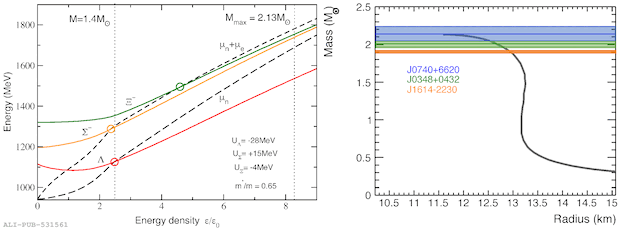
(Left) Chemical potential $\mu_i$ of hyperons produced in the inner core of a NS as a function of the energy density, in units of energy density $\epsilon_0$ at the nuclear saturation point. The single-particle potentials depths in symmetric nuclear matter (SNM) for $\Lambda$, $\Sigma$ and $\Xi$ hyperons are displayed. The vertical dotted lines indicate the central energy densities reached for a standard NS of $1.4\,M_\odot$ and for the maximum mass, $2.13\,M_\odot$, reached within this specific EoS. The mean-field calculations~ have been tuned in order to reproduce the lattice predicted value of $U_\Xi$ in pure neutron matter (PNM) obtained in~, using the in-vacuum results validated by ALICE data in ~. The EoS obtained with these constraints provides a stable NS with a maximum mass of $M_{\rm max} = 2.13\,M_\odot$, as seen on the mass-radius plot on the right and is compatible with recent astrophysical measurements of heavy NS, indicated by the orange~, green~ and blue~ bands. See also Ref.~.
Figure extracted from paper