Energy
2.76 TeV
5.02 TeV
7 TeV
8 TeV
13 TeV
System
p-p
Pb-Pb
p-Pb
Figure Group
Figure Image

Figure image (.eps)
Figure Caption
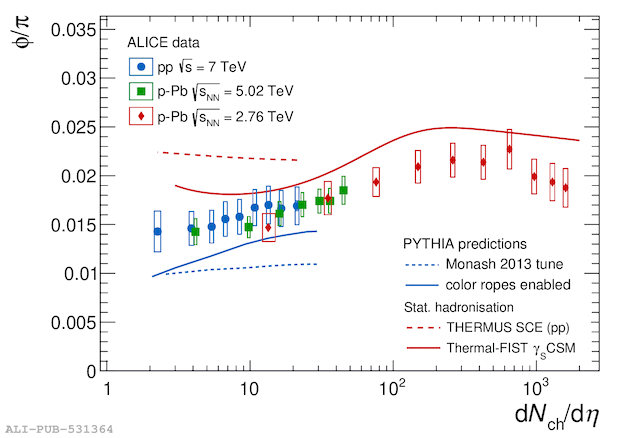
Selected measurements from the previous figures compared to different theoretical models. (Top left) $p_{\rm T}$-integrated ratio of p$/\pi$ as a function of $\langle {\rm d}N_{\rm ch}/{\rm d}\eta \rangle$ at midrapidity. (Top right) $p_{\rm T}$-integrated ratio of $\phi/\pi$ as a function of $\langle {\rm d}N_{\rm ch}/{\rm d}\eta \rangle$ at midrapidity (Bottom left) $p_\mathrm{T}$-integrated ratio of $\Omega/\pi$ as a function of $\langle {\rm d}N_{\rm ch}/{\rm d}\eta \rangle$ at midrapidity compared to PYTHIA 8.2 (Monash 2013 tune)~ and PYTHIA colour ropes model~. (Bottom right) $p_{\rm T}$-integrated ratio of $(\rm{J}/\psi)/\pi$ as a function of $\langle {\rm d}N_{\rm ch}/{\rm d}\eta \rangle$ at midrapidity.
Detail description
Figure extracted from paper
