Energy
2.76 TeV
5.02 TeV
7 TeV
8 TeV
13 TeV
System
p-p
Pb-Pb
p-Pb
Figure Group
Figure Image

Figure image (.eps)
Figure Caption
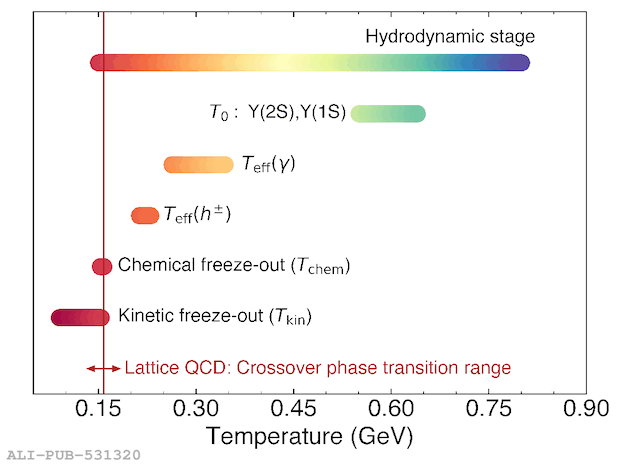
The temperatures ranges probed by central heavy-ion collisions at the LHC derived from ALICE measurements shown throughout the chapter. The region to the right of the red line represents the QGP phase, while the left is the hadronic phase. A lattice QCD calculation for the pseudocritical temperature $T_{\mathrm{pc}}$ and crossover temperature range where the QGP and hadron gas coexist (denoted by the arrows) is also shown~.
Detail description
Figure extracted from paper
