Energy
2.76 TeV
5.02 TeV
7 TeV
8 TeV
13 TeV
System
p-p
Pb-Pb
p-Pb
Figure Group
Figure Image

Figure image (.eps)
Figure Caption
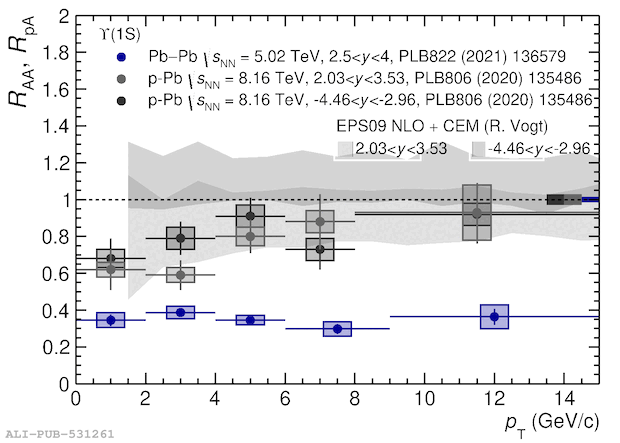
\jpsi (left) and \upsone (right) \RAA as a function of \pt in centrality-integrated \PbPb collisions at \fivenn in $2.5 y_{\mathrm{cms}} 4$ (blue circles)~. Results are compared to the corresponding \RpA values obtained in \pPb collisions at \eightnn in $2.03 y_{\mathrm{cms}} 3.53$ (light gray circles) and $-4.46 y_{\mathrm{cms}} -2.96$ (dark gray circles)~. The gray bands correspond to model calculations based on a pure nuclear shadowing scenario using EPS09LO as set of nuclear parton distribution functions (filled bands)~. For the \jpsi case, a theory calculation based on a CGC approach coupled with a NRQCD production mechanism is also shown (dashed band)~.
Detail description
Figure extracted from paper
