Energy
2.76 TeV
5.02 TeV
7 TeV
8 TeV
13 TeV
System
p-p
Pb-Pb
p-Pb
Figure Group
Figure Image

Figure image (.eps)
Figure Caption
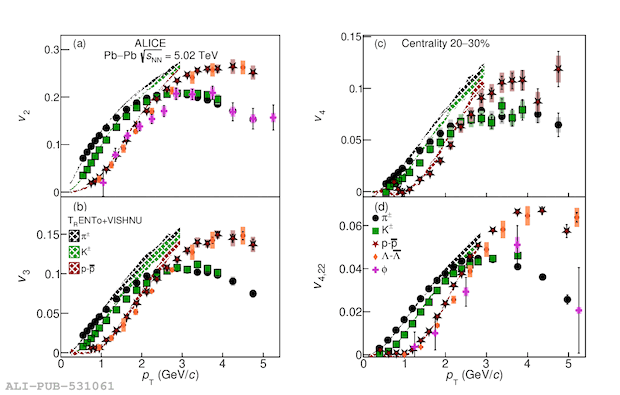
The $p_{\mathrm{T}}$--differential $v_2$ (a), $v_3$ (b), $v_4$ (c), and $v_{4,22}$ (d) measured by ALICE in semicentral (i.e., 20--30\% centrality interval) Pb--Pb collisions at $\sqrt{s_{\mathrm{NN}}} = 5.02$~TeV~. The data points are drawn with their statistical (error bars) and systematic (boxes) uncertainties. The curves represent estimations extracted from T$_{\rm{R}}$ENTo+VISHNU that give the best description of other anisotropic flow measurements among all models studied.
Detail description
Figure extracted from paper
