Energy
2.76 TeV
5.02 TeV
7 TeV
8 TeV
13 TeV
System
p-p
Pb-Pb
p-Pb
Figure Group
Figure Image

Figure image (.eps)
Figure Caption
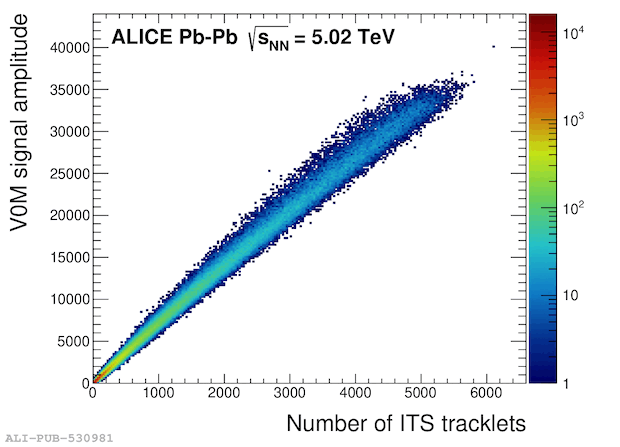
Summed signal amplitude in the V0 scintillators in triggered \PbPb~collisions at \sqrtSnn~=~5.02~\TeV (Top) Correlation between the V0M amplitude, at forward rapidity, and the number of charged-particle track segments (tracklets) reconstructed in the ITS at midrapidity ($\vert\eta\vert1.4$). (Bottom) Fit (red line) to the V0M distribution with a Glauber model coupled to a negative binomial distribution (NBD). Gray and white bands indicate the classification of the events into centrality classes, with centrality expressed in percentile of the hadronic cross section.
Detail description
Figure extracted from paper
