Scope: PWG
PWG-MM (Monte Carlo generators and Minimum Bias)
Energy
5.02 TeV
System
p-p
p-Pb
Figure Image
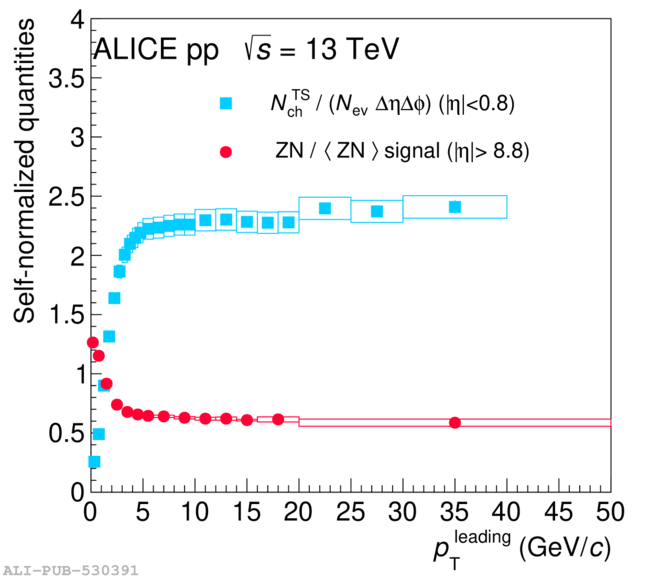
Figure image (.eps)
Figure image (.pdf)
Figure Caption
Self-normalised ZN signal (red circles) and number density $N_{ch}$ (azure squares) distribution in the transverse region (published in Ref.~) as a function of $\pt^{\rm leading}$ measured in $|\eta| $0.8. Tracks have \pt$>$0.15~GeV/c, markers are placed at the centre and not at the average of the \pt leading bin.
Detail description
Figure extracted from paper