Scope: PWG
PWG-HF (Heavy Flavour)
Energy
5.02 TeV
System
p-p
p-Pb
Figure Image
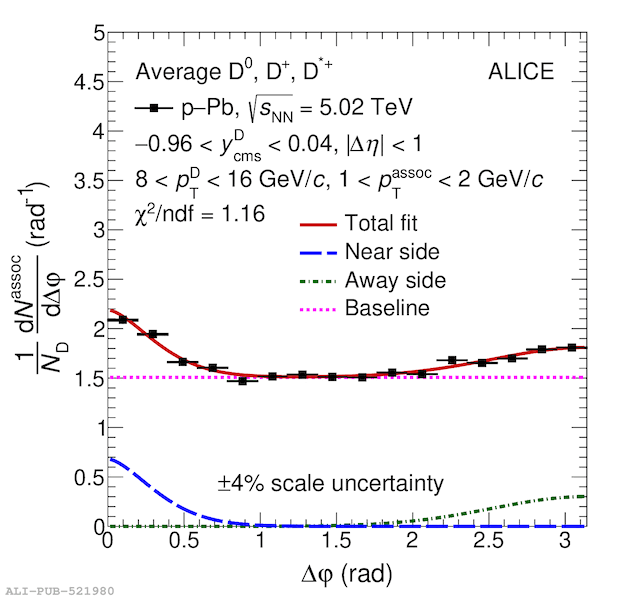
Figure image (.eps)
Figure image (.pdf)
Figure Caption
Examples of the fit to the D-meson average azimuthal-correlation function, for $5 \ptD 8$~\GeVc, $\ptass > 0.3$~\GeVc in pp collisions (left), and for $8 \ptD 16$~\GeVc, $1 \ptass 2$~\GeVc in \pPb collisions (right). The statistical uncertainties are shown as vertical error bars. The fit function described in Eq.~\ref{equ:Fit} is shown as a red solid curve. Its different terms are shown separately: near-side generalised Gaussian function, away-side Gaussian function, and baseline constant term. The scale uncertainty (see Sec.~\ref{sec:Systematics}) is also reported for completeness.
Detail description
Figure extracted from paper