Scope: PWG
PWG-LF (Light Flavour Spectra)
Energy
5.02 TeV
System
Pb-Pb
Figure Image
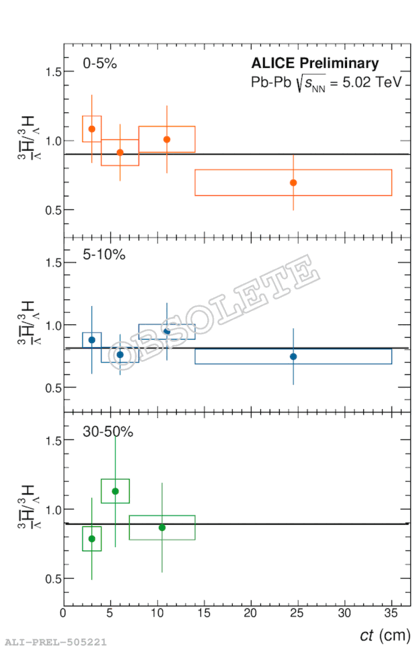
Figure image (.eps)
Figure image (.pdf)
Figure Caption
$^3_{\overline{\Lambda}}\overline{\mathrm{H}}/{}^3_{\Lambda}\mathrm{H}$ ratio measured as a function of the proper decay length $ct$ in the 0-5% (orange, top panel), 5-10% (blue, central panel) and 30-50% (green, bottom panel) centrality intervals. The vertical bars represent the statistical uncertainties, the boxes show the uncorrelated systematic uncertainties. The weighted averages of the $ct$-differential measurements are shown as horizontal black lines for each centrality interval.