Energy
5.02 TeV
System
p-p
p-Pb
Figure Group
Figure Image

Figure image (.eps)
Figure image (.pdf)
Figure Caption
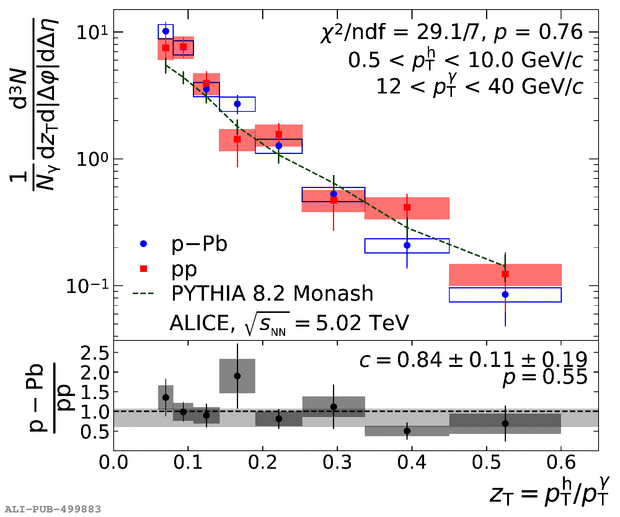
$\gammaiso$-tagged fragmentation function for pp (red) and \pPb~data (blue) at $\sqrt{s_\mathrm{NN}}$ = 5.02 TeV as measured by the ALICE detector. The boxes represent the systematic uncertainties while the vertical bars indicate the statistical uncertainties. The dashed green line corresponds to \textsc{PYTHIA 8.2}. The $\chi^2$ test for the comparison of pp and \pPb~data incorporates correlations among different \zt~intervals. A constant that was fit to the ratio including statistical and systematic uncertainties is shown as grey band, with the width indicating the uncertainty on the fit.
Detail description
Figure extracted from paper
