Energy
5.02 TeV
System
p-p
p-Pb
Figure Group
Figure Image

Figure image (.eps)
Figure image (.pdf)
Figure Caption
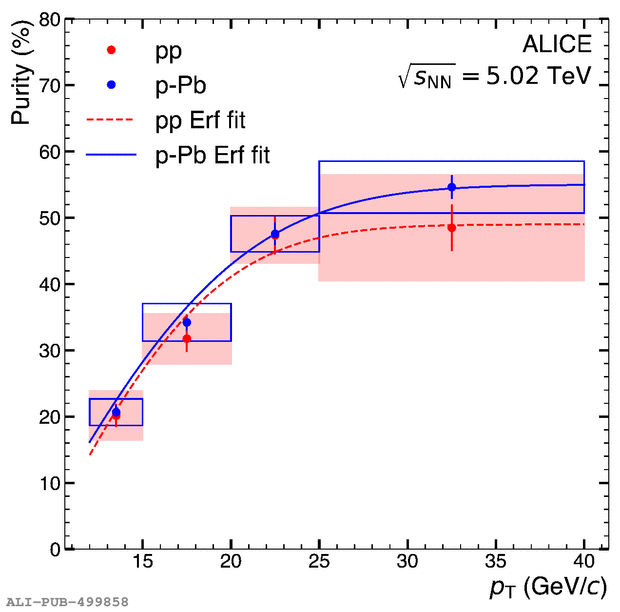
Purity of the $\gammaiso$ sample as a function of transverse momentum for pp (red) and \pPb~(blue) data. The error bars represent statistical uncertainties only. The red shaded area represents systematic uncertainties in pp, while the blue empty boxes represent systematic uncertainties in \pPb. The smooth lines correspond to a three-parameter error function fit to the data.
Detail description
Figure extracted from paper
