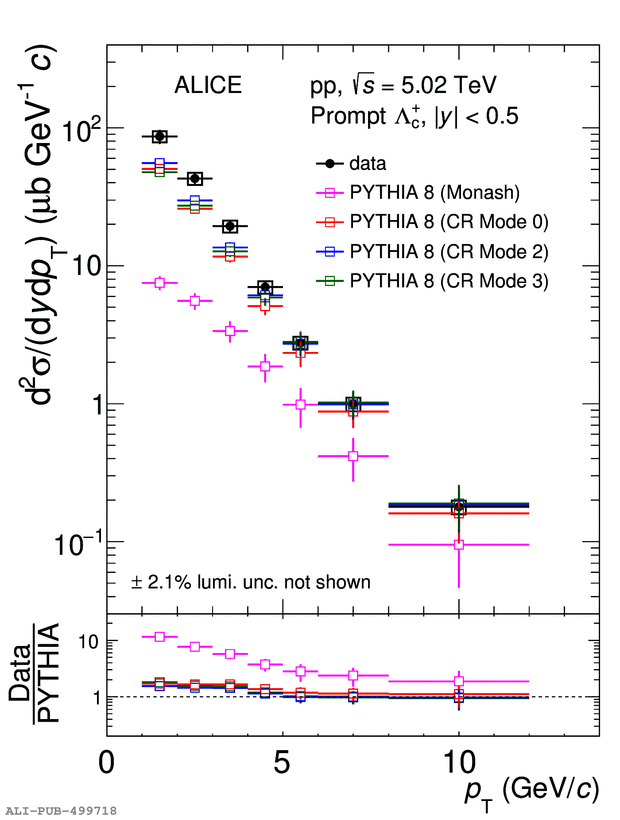
Prompt \Lcplus-baryon \pt-differential production cross section in \pp collisions at \sqrtsfive in the interval $1 \pt 12~\gevc$. The statistical uncertainties are shown as vertical bars and the systematic uncertainties are shown as boxes. Left: Comparison to predictions from different tunes of the \mbox{PYTHIA 8} event generator~~. The vertical bars on the \mbox{PYTHIA 8} predictions represent the statistical uncertainty from the simulation, and the vertical bars on the ratios in the bottom panel also include the statistical uncertainties from the data. Right: Comparison to predictions from the POWHEG event generator~ and GM-VFNS calculations~. The orange(blue) boxes represent the uncertainties of POWHEG(GM-VFNS) due to the choice of pQCD scales. See text for details on the \mbox{PYTHIA 8} and POWHEG event generator settings.
Figure extracted from paper
