Scope: PWG
PWG-MM (Monte Carlo generators and Minimum Bias)
Energy
5.02 TeV
System
p-p
Figure Image

Figure image (.eps)
Figure image (.pdf)
Figure Caption
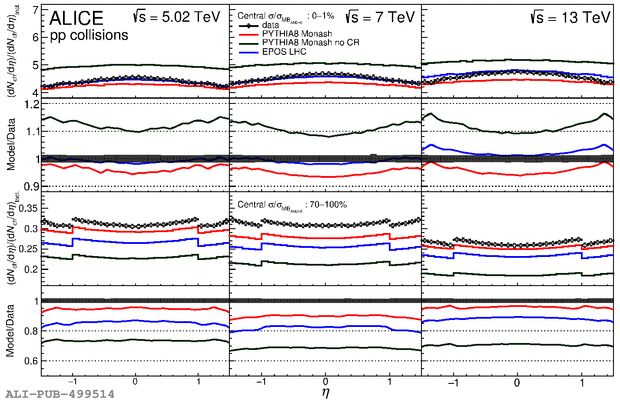
The panels in the first and third row show the normalised pseudorapidity density distributions of charged particles in pp collisions at \s~=~5.02, 7 and \unit[13]{TeV} compared with different models for the 0--1\% and 70--100\% multiplicity classes by the midrapidity multiplicity estimator, respectively. The panels in the second and fourth row report the corresponding model/data ratio. The multiplicity classes of the models correspond to \multcc, which is slightly different from the \multc\ of the ALICE data.
Detail description
Figure extracted from paper
