Scope: PWG
PWG-MM (Monte Carlo generators and Minimum Bias)
Energy
5.02 TeV
System
p-p
Figure Image

Figure image (.eps)
Figure image (.pdf)
Figure Caption
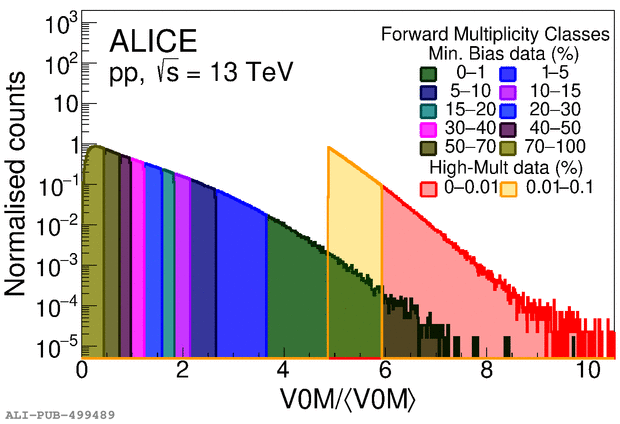
The distribution of the V0M amplitude (total energy deposition in the region $-3.7\eta-1.7$ and $2.8\eta5.1$) scaled by its average value $\langle \rm V0M \rangle$ that is used to determine the forward multiplicity classes (a) and the distribution of the total number of SPD tracklets in an event ($N_\mathrm{SPD\,\,Tracklet}$, $-2\eta2$) scaled by its average value $\langle N_\mathrm{SPD\,\,Tracklet} \rangle$ that is used to determine the midrapidity multiplicity classes (b) in pp collisions at $\s$~=~\unit[13]{TeV}. Note that the percentile values of the multiplicity classes are fractions of the visible cross section $\multc$ (see text for details).
Detail description
Figure extracted from paper
