Scope: PWG
PWG-LF (Light Flavour Spectra)
Energy
5.44 TeV
System
Xe-Xe
Figure Group
Figure Image

Figure image (.eps)
Figure image (.pdf)
Figure Caption
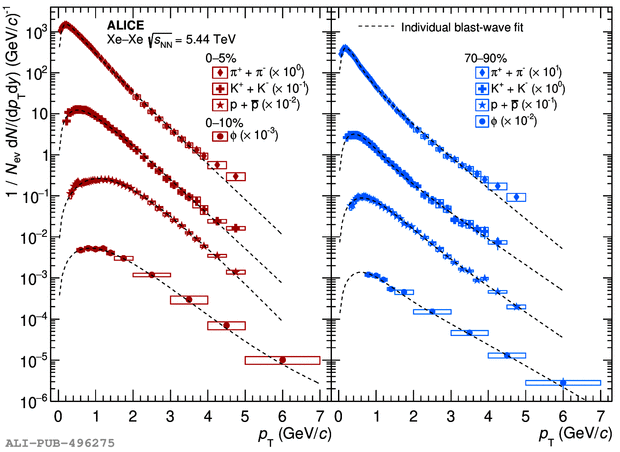
\pt distributions of \ppipm, \pkapm, \pprp, \pprm, \pphi as measured in central (left) and peripheral (right) \xexe collisions at \snnXeXe The statistical and systematic uncertainties are shown as error bars and boxes around the data points
Detail description
Figure extracted from paper
