Scope: PWG
PWG-LF (Light Flavour Spectra)
Energy
5.02 TeV
System
Pb-Pb
Figure Group
Figure Image

Figure image (.eps)
Figure image (.pdf)
Figure Caption
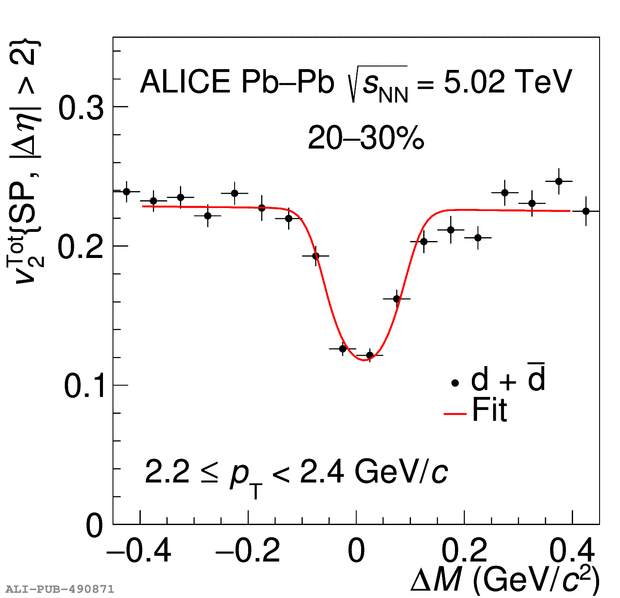
Raw yield (left), \vtwo (middle) and \vthree (right) of d+\dbar\ candidates as a function of $\Delta \rm{M}$ for $2.2~\leq$~\pt~$2.4$~\GeVc ($2.0~\leq$~\pt~$2.4$~\GeVc for \vthree) and in the centrality interval 20--30\%. The data points represent the measurements. The curve on the left panel is the total fit (signalplus background) as described in the text. The curves in the middle and right panel are the fits performed using Eq.~???. Vertical bars represent the statistical uncertainties.
Detail description
Figure extracted from paper
