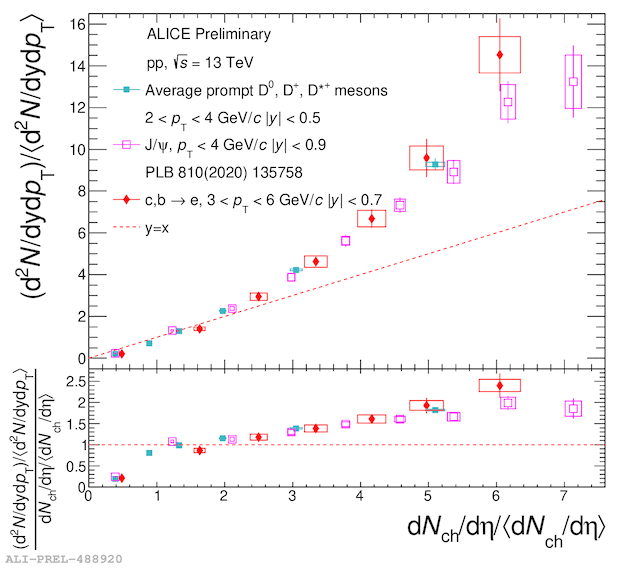
Average D-meson, J/$\psi$, and heavy-flavour electron self normalised yields vs relative charged-particle multiplicity at central rapidity in pp 13 TeV. D meson yields are shown for 2 < pT < 4 GeV/c, at |y| < 0.5 represented by cyan filled squares, J/$\psi$ yields are for pT < 4 GeV/c, at |y| < 0.9 represented by magenta open squares, and HFe yields are shown for 3 < pT < 6 GeV/c, at |y| < 0.7 in red filled diamonds. The data points are presented in the top panel with their statistical (vertical bars) and systematic (boxes) uncertainties (not showing the feed-down fraction for D mesons). The bottom panel shows the comparison of the double ratios between the species as a function of relative charged-particle multiplicity.
Average D-meson, J/$\psi$, and heavy-flavour electron self normalised yields vs relative charged-particle multiplicity at central rapidity in pp 13 TeV. D meson yields are shown for 2 < pT < 4 GeV/c, at |y| < 0.5 represented by cyan filled squares, J/$\psi$ yields are for pT < 4 GeV/c, at |y| < 0.9 represented by magenta open squares, and HFe yields are shown for 3 < pT < 6 GeV/c, at |y| < 0.7 in red filled diamonds. The data points are presented in the top panel with their statistical (vertical bars) and systematic (boxes) uncertainties (not showing the feed-down fraction for D mesons). The bottom panel shows the comparison of the double ratios between the species as a function of relative charged-particle multiplicity.
