Scope: PWG
PWG-CF (Flow and Correlations)
Energy
13 TeV
System
p-p
Figure Image

Figure image (.eps)
Figure image (.pdf)
Figure Caption
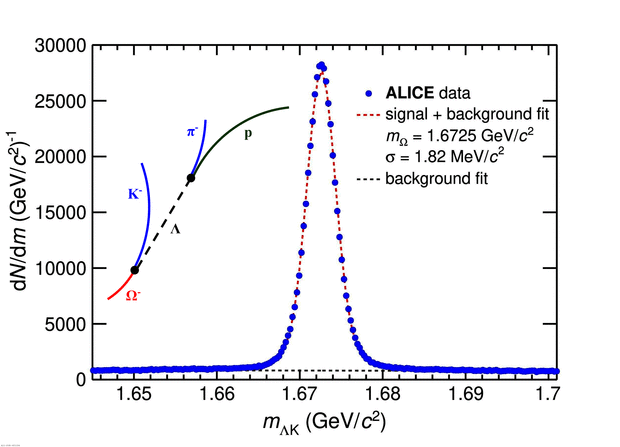
Reconstruction of the \omm and \omp signals. Sketch of the weak decay of \omm into a $\Lambda$ and a K$^{-}$,and measured invariant mass distribution (blue points) of $\Lambda$K$^{-}$ and $\overline{\Lambda}$K$^{+}$ combinations The dotted red line represents the fit to the data including signal and background,and the black dotted line the background alone The contamination from misidentification is $\leq$ \fakeOmega\si{\percent}.
Detail description
Figure extracted from paper
