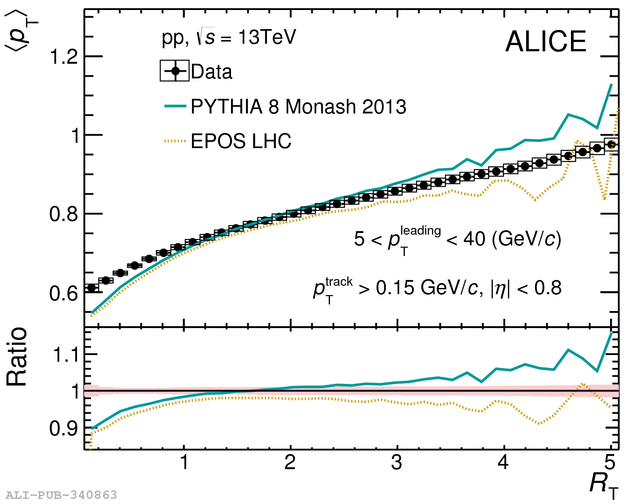
Fig.10: $\avpt$ in the Transverse region as a function of \Rt\ for $\ptmin > 0.15 \; \gmom $ and $|\eta | < 0.8$. Data (solid circles) are compared to the results of \textsc{Pythia}~8 and \textsc{Epos} LHC calculations (lines). The open boxes represent the systematic uncertainties and vertical error bars indicate statistical uncertainties. No uncertainties are shown for the MC calculations. The bottom panel shows the ratio of the MC to data.
Fig.10: $\avpt$ in the Transverse region as a function of \Rt\ for $\ptmin > 0.15 \; \gmom $ and $|\eta | < 0.8$. Data (solid circles) are compared to the results of \textsc{Pythia}~8 and \textsc{Epos} LHC calculations (lines). The open boxes represent the systematic uncertainties and vertical error bars indicate statistical uncertainties. No uncertainties are shown for the MC calculations. The bottom panel shows the ratio of the MC to data.