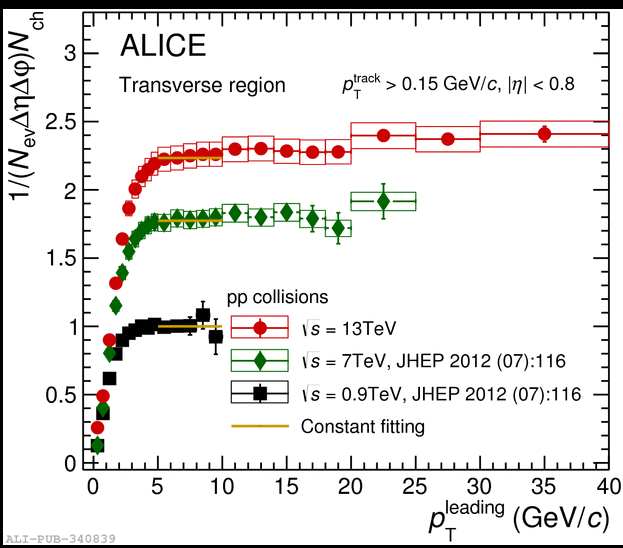
Fig.6: Left: Number density $\Nch$ in the Transverse region as a function of \ptlead\ ($\ptmin > 0.15 \; \gmom$ threshold) for $\sqrt{s} = $ 0.9, 7 and 13~$\TeV$. A constant function is used to fit the data in the range $5 < \ptlead < ~ 10 \; \gmom$ and the results are shown as solid lines.
Right: Number densities $\Nch$ scaled by the pedestal values obtained from the fit in order to compare the shapes. The open boxes represent the systematic uncertainties and vertical error bars indicate statistical uncertainties.
