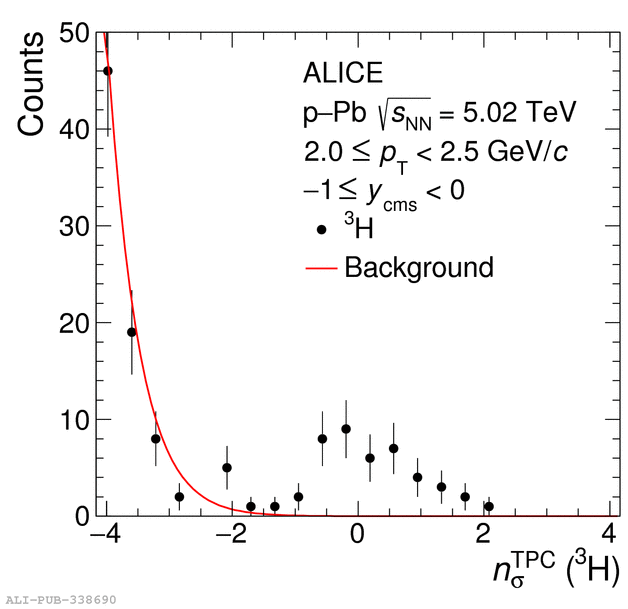
Figure 1b: The distribution of the specific ionization energy loss (d$E$/d$x$) in the TPC of the candidate tracks compared to the expected value for $^3$H($n_\sigma^\mathrm{TPC}$) in the $p_\mathrm{T}$ range of 2.0 GeV/$c$ $\le \pt < 2.5$ GeV/$c$. The background, which is visible as a slope on the left side of the signal, is fitted with a Gaussian function shown in red to estimate the contamination.
Figure 1b: The distribution of the specific ionization energy loss (d$E$/d$x$) in the TPC of the candidate tracks compared to the expected value for $^3$H($n_\sigma^\mathrm{TPC}$) in the $p_\mathrm{T}$ range of 2.0 GeV/$c$ $\le \pt < 2.5$ GeV/$c$. The background, which is visible as a slope on the left side of the signal, is fitted with a Gaussian function shown in red to estimate the contamination.
Data sample: LHC16q_pass1_FAST, LHC16q_pass1_CENT_woSDD