p.p1 {margin: 0.0px 0.0px 0.0px 0.0px; font: 12.0px Helvetica; color: #000000}
Distributions of p.p1 {margin: 0.0px 0.0px 0.0px 0.0px; font: 12.0px Helvetica; color: #000000}
$\left( \mathrm{d}E/\mathrm{d}x - \langle \mathrm{d}E/\mathrm{d}x \rangle_{^{3}\mathrm{He}} \right) /\sigma^{^{3}\mathrm{He}}_{\mathrm{d}E/\mathrm{d}x}$
measured in the TPC for the transverse-momentum ranges $2\ \leq p_{\mathrm{T}} < 3\ \mathrm{GeV}/\textit{c}$ (left) and $3\ \leq p_{\mathrm{T}} < 4\ \mathrm{GeV}/\textit{c}$ (right). The vertical bars represent the statistical uncertainties of the data. The blue and the red dash-dotted lines indicate the $^{3}$H and $^{3}$He contributions, respectively, while the black solid lines are the total fits. The ranges used for the signal extraction are indicated by the vertical red-dotted black lines.
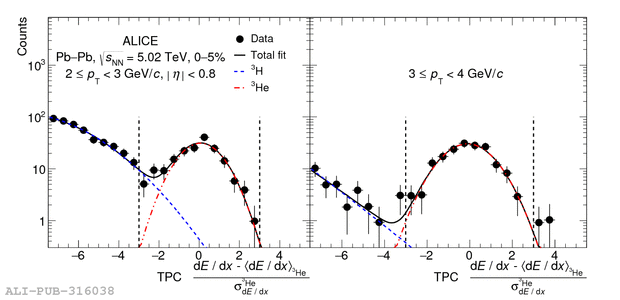
Distributions of
$\left( \mathrm{d}E/\mathrm{d}x - \langle \mathrm{d}E/\mathrm{d}x \rangle_{^{3}\mathrm{He}} \right) /\sigma^{^{3}\mathrm{He}}_{\mathrm{d}E/\mathrm{d}x}$
measured in the TPC for the transverse-momentum ranges $2\ \leq p_{\mathrm{T}} < 3\ \mathrm{GeV}/\textit{c}$ (left) and $3\ \leq p_{\mathrm{T}} < 4\ \mathrm{GeV}/\textit{c}$ (right). The vertical bars represent the statistical uncertainties of the data. The blue and the red dash-dotted lines indicate the $^{3}$H and $^{3}$He contributions, respectively, while the black solid lines are the total fits. The ranges used for the signal extraction are indicated by the vertical red-dotted black lines.