Energy
2.76 TeV
5.02 TeV
7 TeV
8 TeV
13 TeV
System
p-p
Pb-Pb
p-Pb
Figure Group
Figure Image

Figure image (.eps)
Figure Caption
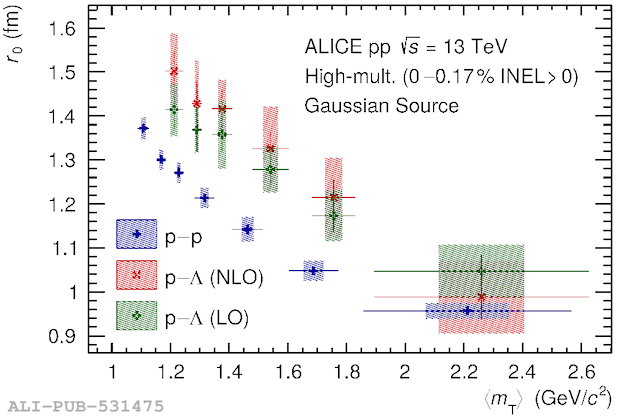
(Left) Source radius $r_\mathrm 0$ as a function of $\langle\mt\rangle$ for the assumption of a purely Gaussian source. (Right) Source radius $r_{\mathrm{core}}$ as a function of $\langle\mt\rangle$ for the assumption of a Gaussian source with added resonances. The blue crosses result from fitting the \pP correlation function with the strong Argonne $v_{18}$~ potential. The green squared crosses (red diagonal crosses) result from fitting the \pL correlation functions with the strong $\chi$EFT LO~ (NLO~) potential. Statistical and systematic uncertainties are indicated by vertical bars and boxes, respectively~.
Detail description
Figure extracted from paper
