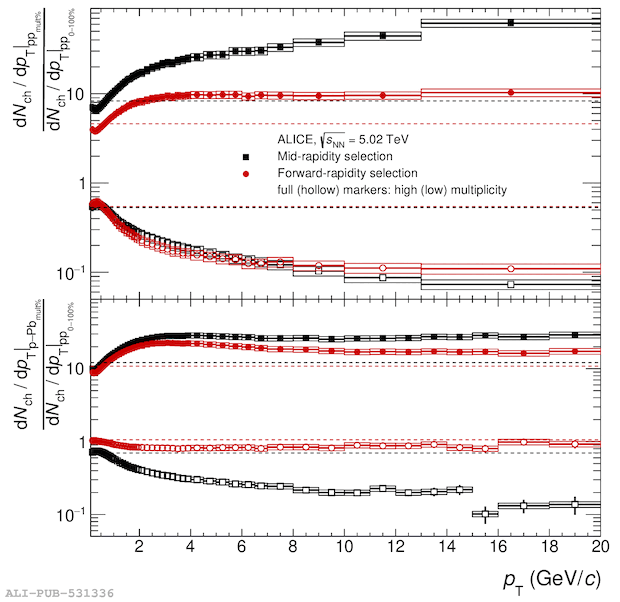
Ratios of multiplicity-selected transverse-momentum distributions of charged particles for pp collisions (top)~ and p--Pb collisions (bottom)~ to inelastic pp collisions, shown in logarithmic scale. For pp collisions, the forward-rapidity event selection is done using the V0M multiplicity estimator ($-3.7 <\eta< -1.7$, $2.8 <\eta< 5.1$), while the midrapidity event selection is done using the SPD tracklets in $|\eta|<0.8$. For p--Pb collisions, the forward-rapidity event selection is done using the A-side of the V0 multiplicity estimator ($2.8 <\eta< 5.1$), corresponding to the Pb-going side, while the midrapidity event selection is done using the first layer of the SPD. The horizontal dashed lines denote the integrated charged-particle multiplicity density ratios as a reference. For this figure, the pp high-multiplicity event classes correspond to 0--1\% (V0M-based, forward-rapidity selection) and 0.009--0.088\% (SPD-based, midrapidity selection) and the low-multiplicity pp event classes correspond to 70--100\% (V0M) and 49.5--100.0\%, where percentiles are defined with respect to the total pp INEL$>$0 cross section. For all event selections, the p--Pb high-multiplicity and low-multiplicity event classes correspond to 0--5\% and 70--100\%, respectively, with percentiles defined with respect to the total visible V0A cross section.
Figure extracted from paper
