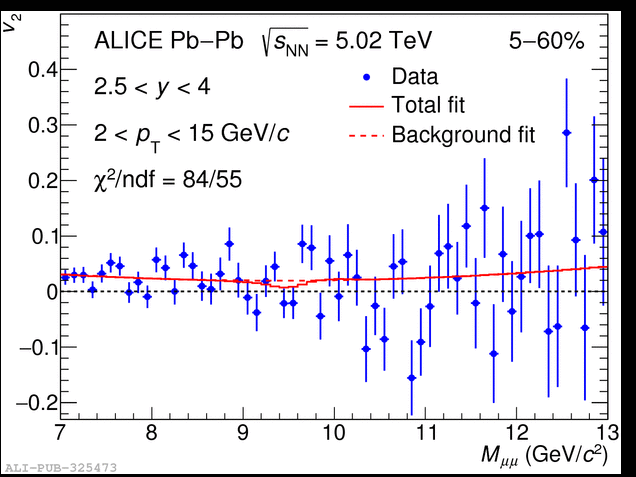
The $v_2(M_{\mu\mu})$ distribution in the 5--60\% centrality interval and 2 $< \pt <$ 15 GeV/$c$ fitted ith the function from Eq.~(2).
The dimuon $v_2$ is measured using the scalar product method~\cite{Adler:2002pu, Voloshin:2008dg}, correlating the reconstructed dimuons with the second-order harmonic event flow vector ${\bf Q}_2^{\rm SPD}$~\cite{Voloshin:1994mz, Barrette:1994xr} calculated from the azimuthal distribution of the reconstructed SPD tracklets
%
\begin{equation}
% v_{2}\{{\rm SP}\} = \langle \langle {\bf u}_{2, k} {\bf Q}_2^{\rm SPD *} \rangle \rangle \Bigg/ \sqrt{ \frac{\langle {\bf Q}_2^{\rm SPD} {\bf Q}_2^{\rm V0A *} \rangle \langle {\bf Q}_2^{\rm SPD} {\bf Q}_2^{\rm V0C *} \rangle} { \langle {\bf Q}_2^{\rm V0A} {\bf Q}_2^{\rm V0C *} \rangle } },
v_{2}\{{\rm SP}\} = \Bigg\langle {\bf u}_{2} {\bf Q}_2^{\rm SPD *}\Bigg/ \sqrt{ \frac{\langle {\bf Q}_2^{\rm SPD} {\bf Q}_2^{\rm V0A *} \rangle \langle {\bf Q}_2^{\rm SPD} {\bf Q}_2^{\rm V0C *} \rangle} { \langle {\bf Q}_2^{\rm V0A} {\bf Q}_2^{\rm V0C *} \rangle } } \Bigg\rangle_{\mu\mu},
\label{eq:mth_sp}
\end{equation}
%
where ${\bf u}_{2} =\exp(i2\varphi)$ is the unit flow vector of the dimuon with azimuthal angle $\varphi$. The brackets $\langle \cdots \rangle_{\mu\mu}$ denote an average over all dimuons belonging to a given $\pt$, $M_{\mu\mu}$ and centrality interval. The ${\bf Q}_2^{\rm V0A}$ and ${\bf Q}_2^{\rm V0C}$ are the event flow vectors calculated from the azimuthal distribution of the energy deposition measured in the V0A and V0C detectors, respectively, and $^*$ is the complex conjugate. The brackets $\langle \cdots \rangle$ in the denominator denote an average over all events in a sufficiently narrow centrality class which encloses the event containing the dimuon. In order to account for a non-uniform detector response and efficiency, the components of all three event flow vectors are corrected using a recentering procedure~\cite{Selyuzhenkov:2007zi}. The gaps in pseudorapidity between the muon spectrometer and SPD ($|\Delta\eta|>1.0$) and between the SPD, V0A, and V0C remove auto-correlations and suppress short-range correlations unrelated to the azimuthal asymmetry in the initial geometry (``non-flow''), which largely come from jets and resonance decays. In the following, the $v_{2}\{{\rm SP}\} $ coefficient is denoted as $v_2$.
%The dimuon $v_2$ is measured using the scalar product method~\cite{Adler:2002pu, Voloshin:2008dg}, where the event flow vector ${\bf Q}_2$ is calculated from the azimuthal distribution of the reconstructed SPD tracklets. In order to account for the non-uniform detector response and efficiency, the components of the ${\bf Q}_2$ are corrected using a recentering procedure~\cite{twist}. The gap in pseudorapidity between dimuons and ${\bf Q}_2$ ($|\Delta\eta|>1.0$) removes auto-correlations and suppresses short-range correlations unrelated to the azimuthal asymmetry in the initial geometry (``non-flow''), which arise mostly from jets and resonance decays.
The $\Upsilon(1{\rm S})$ $v_2$ coefficient is obtained by a least squares fit of the superposition of the $\Upsilon$(1S) signal and the background to the dimuon flow coefficient as a function of the dimuon invariant mass~\cite{Borghini:2004ra}
%
\begin{equation}
% v_{2}(M_{\mu\mu}) = \frac{N^{\Upsilon{\rm (1S)}}}{N^{\Upsilon{\rm (1S)}}+N^{\rm B}}v_{2}^{\Upsilon{\rm (1S)}} + \frac{N^{\rm B}}{N^{\Upsilon{\rm (1S)}}+N^{\rm B}}v_{2}^{\rm B}(M_{\mu\mu}),
v_{2}(M_{\mu\mu}) = \alpha(M_{\mu\mu})v_{2}^{\Upsilon{\rm (1S)}} + [1-\alpha(M_{\mu\mu})]v_{2}^{\rm B}(M_{\mu\mu}),
\label{eq:v2_sb}
\end{equation}
%
where $v_{2}^{\Upsilon{\rm (1S)}}$ is the flow coefficient of the signal, $v_{2}^{\rm B}$ is the $M_{\mu\mu}$-dependent flow coefficient of the background and $\alpha(M_{\mu\mu})$ is the signal fraction, obtained from the fit of the $M_{\mu\mu}$ distribution described above. %The event-mixing technique developed in Ref.~\cite{Acharya:2018pjd} in order to fix $v_{2}^B$ is not applied here due to the presence of significant correlated background. Nevertheless, based on the results from the application of this technique a second-order polynomial function is chosen as default $v_{2}^B$($M_{\mu\mu}$) parameterization.
The background $v_2^{\rm B}$ is modeled as a second-order polynomial function of $M_{\mu\mu}$.
For consistency, and despite its low yield, the $\Upsilon$(2S) is included in the fit by restricting the value of its $v_2$ coefficient within the range between $-$0.5 and 0.5. In practice, this inclusion has a negligible impact on the $\Upsilon$(1S) fit results.
%The $\Upsilon$(3S) is not included in the fit as no statistically significant signal is observed in the $M_{\mu\mu}$ distribution (see left panel of Fig.~\ref{fig:fits}).
